Delivered
Usage-driven QuickSight cleanup
Activity logs and API inventory snapshots, joined in Athena, to find the dashboards, analyses, and datasets nobody used and archive them automatically: about 1,100 assets removed and SPICE storage cut from 2.4 TB to about 700 GB.
- Context
- Advertising technology
- Period
- 2024
- My role
- Data Platform Lead (designer and builder)
- Stack
Live architecture
Usage logs in, unused assets out
Pick a component to trace what it sends and receives.
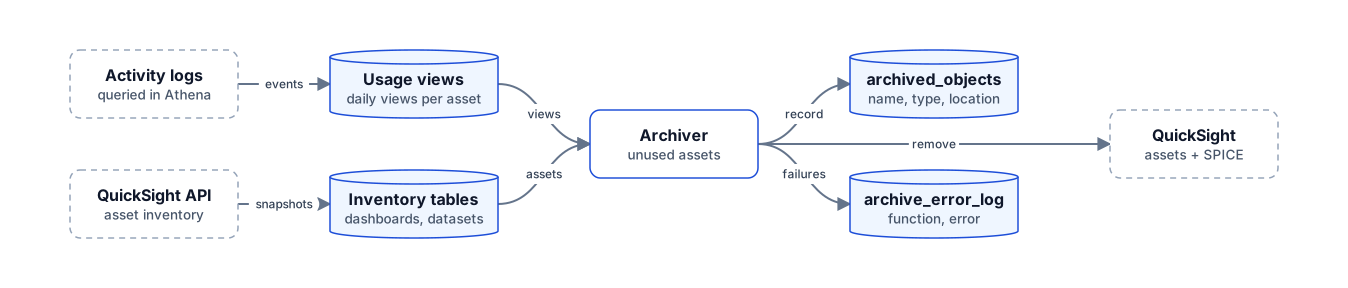
QuickSight activity logs and API inventory snapshots land in Athena. Daily usage views show which dashboards, analyses, and datasets anyone actually opened. The archiver removes assets nobody uses, records each one with where its definition went, and logs any failure to its own table.
Activity logs queried in Athena
QuickSight API activity, scraped into Athena tables.
Sends to: Usage views (events)
QuickSight API asset inventory
Snapshots of every dashboard, analysis, dataset, schedule, and refresh.
Sends to: Inventory tables (snapshots)
Usage views daily views per asset
Daily views per dashboard and analysis, by user, plus dataset state and size.
Receives from: Activity logs (events)
Sends to: Archiver (views)
Inventory tables dashboards, datasets
The current state of every asset, ready to join against usage.
Receives from: QuickSight API (snapshots)
Sends to: Archiver (assets)
Archiver unused assets
Joins inventory to usage, archives what nobody uses, and keeps going when one asset fails.
Receives from: Usage views (views), Inventory tables (assets)
Sends to: archived_objects (record), archive_error_log (failures), QuickSight (remove)
archived_objects name, type, location
Every archived asset with its name, type, the location of its definition, and when it was archived.
Receives from: Archiver (record)
archive_error_log function, error
Failures are recorded per function instead of stopping the run.
Receives from: Archiver (failures)
QuickSight assets + SPICE
About 1,100 assets archived, and SPICE storage down from a 2.4 TB peak to about 700 GB.
Receives from: Archiver (remove)
Text description of this diagram
QuickSight activity logs and API inventory snapshots land in Athena. Daily usage views show which dashboards, analyses, and datasets anyone actually opened. The archiver removes assets nobody uses, records each one with where its definition went, and logs any failure to its own table.
- Activity logs (queried in Athena): QuickSight API activity, scraped into Athena tables. Sends to Usage views (events).
- QuickSight API (asset inventory): Snapshots of every dashboard, analysis, dataset, schedule, and refresh. Sends to Inventory tables (snapshots).
- Usage views (daily views per asset): Daily views per dashboard and analysis, by user, plus dataset state and size. Sends to Archiver (views).
- Inventory tables (dashboards, datasets): The current state of every asset, ready to join against usage. Sends to Archiver (assets).
- Archiver (unused assets): Joins inventory to usage, archives what nobody uses, and keeps going when one asset fails. Sends to archived_objects (record), archive_error_log (failures), QuickSight (remove).
- archived_objects (name, type, location): Every archived asset with its name, type, the location of its definition, and when it was archived.
- archive_error_log (function, error): Failures are recorded per function instead of stopping the run.
- QuickSight (assets + SPICE): About 1,100 assets archived, and SPICE storage down from a 2.4 TB peak to about 700 GB.
The problem
QuickSight had accumulated years of dashboards, analyses, and datasets. Business users didn’t know what existed or what most of it was for, and neither did anyone else with confidence. SPICE storage peaked at 2.4 TB. The bill has two parts, per-user fees and storage, and storage is the one that moves.
Cleaning that up by hand doesn’t work. You can’t tell whether a dashboard is dead by looking at it, and nobody wants to be the person who deleted the one an executive opens once a quarter. The decision needed evidence, and the evidence was in the logs.
How it works
Two inputs, both landing in Athena. The diagram above follows them through.
Usage. QuickSight activity logs are queried in Athena and rolled up into daily views: views per dashboard and per analysis by user, plus each dataset’s state, size, and import mode.
Inventory. Snapshots from the QuickSight API fill tables for the current dashboards, analyses, datasets, schedules, and refresh history.
The archiver joins inventory to usage and removes the assets nobody is using. Each archived asset is written to an archived_objects table with its name, type, the location of its definition, and when it was archived. A failure on one asset goes to an archive_error_log table with the function and the error, and the run keeps going.
Decisions
Usage over opinion. Logs answer the question the same way for every asset, without depending on anyone’s memory of what they still open.
Record before removing. The archive table is the receipt: what went, what type it was, where its definition went, and when. If someone does come looking for something, the answer is a query.
One failure doesn’t stop the run. Errors are logged with the function that hit them and the run continues, so a problem with one asset costs a row in an error table instead of the whole cleanup.
What it enabled
About 1,100 assets were archived, and SPICE storage fell from its 2.4 TB peak to about 700 GB. As far as I could tell, users didn’t notice, which is the point of archiving by usage.
It also cleared the way for a second track on what remained: generating datasets from configuration, deploying them identically to dev, test, and production, and sharing them through folders automatically instead of one by one.
Tradeoffs and lessons
Logs only show what was logged. A rarely used asset can look dead in a short window, so the usage window has to be long enough to catch quarterly readers.
Cleanup is a prerequisite, not a project. The storage drop was the visible result. The bigger one was that the BI layer became small enough to manage deliberately.